


Home

What is Flywheel Home?
The Home page in Flywheel is a unified analytics dashboard containing all your key marketing and product metrics. It’s also the first dashboard to connect marketing and product data together in the same place. Whether you want to view account or contact-level analytics, the Home page has you covered — automatically. Simply integrate data sources for your website and product to see results.
The Flywheel Home also allows you to filter every Home metric at once according to custom user Segments created in Flywheel. It’s persona-based analytics for your business. A user Segment can be created using any combination of event activity, marketing interactions, company firmographics, or user demographics. Check out our Segments documentation to learn more.
As a last note, we will link to various Segment.io articles to explain concepts throughout this documentation. All of these practices apply identically if you're using our Flywheel.js tracking snippet — they're built on the same underlying technology.
Here we go!
Explaining the Home page metrics
Active today
For contacts
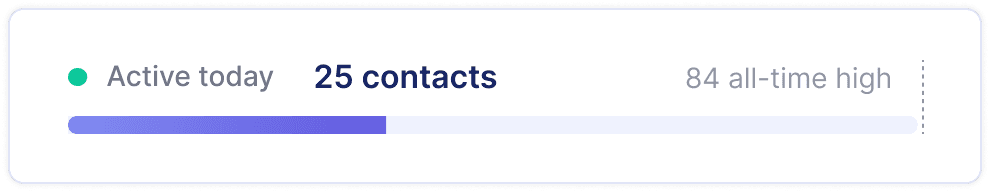
The number of contacts who triggered an event today, also known as an Active Contact. This number is currently calculated using Greenwich Mean Time (GMT) for consistency across timezones, but will soon match the timezone of the original user for an instance.
For accounts
The number of accounts who had at least one active contact today. Uses the same Greenwich Mean Time for the calculation as the contacts variant.
The Active today section also shows your all-time-high figure as a benchmark to evaluate your company's progress. If you set a new record, the bar will turn green and say “All-time high”. The same behavior happens for contacts and accounts.
Customers
All Customer-related metrics in Flywheel currently rely on our Stripe integration. If you haven’t yet connected Stripe, these metrics will always show a value of 0.
For contacts
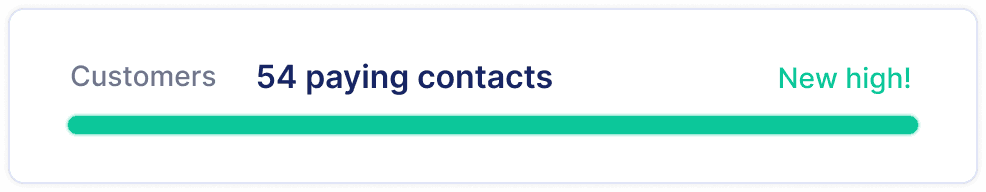
The number of contacts who are listed as the billing contact for an active subscription in Stripe.
For accounts
The number of accounts who have at least one contact listed as having an active subscription in Stripe.
At Flywheel, we define a customer as an account that has at least one contact with an active subscription in Stripe. Similar to the “Active today” metric, it provides you with a benchmark of your all time high figure, and can be viewed at both the contact and account level.
Site Visitors
For contacts
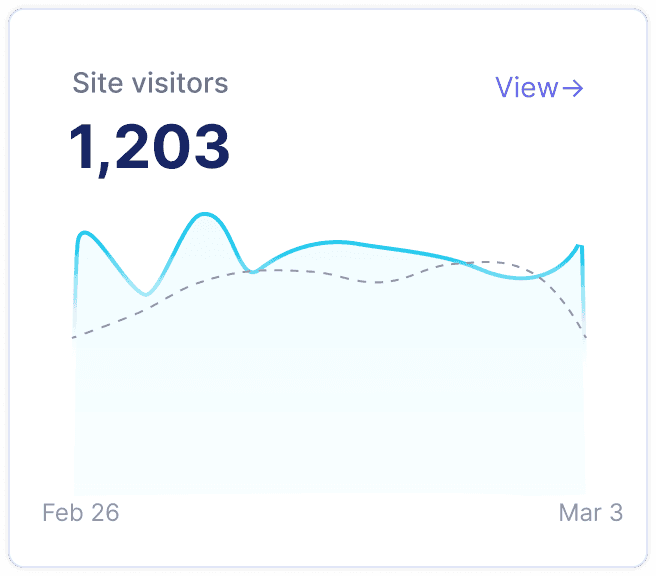
The number of unique visitors to your web surfaces (marketing website, docs, blog, etc) across the last 7 days.
For accounts
The number of accounts who had at least one contact visit your web domains (marketing website, docs, blog, etc) across the last 7 days.
The previous week’s values are represented by a gray dotted line on the chart. This feature allows you to see if your metrics are improving over time.
At Flywheel, a site visitor is a unique contact (identified or anonymous) who visits your website. We only count each unique ID or email once to ensure accurate calculation of this metric. This means that even if a visitor viewed multiple pages on your site, they will be counted as a single site visitor.
For anonymous contacts who visit your site, Flywheel generates and stores an anonymous ID using first-party cookies. If an anonymous contact signs up for your product or provides their email address, Flywheel will record their information and backfill their pre-signup events. This capability enables Flywheel to track the user journey comprehensively, from anonymous visitor, to signed-up user, and, eventually, to customer.
You can also click the “View” link to see the exact contacts or accounts that make up the Site Visitor query result. Customers can export these lists to CSV by clicking the “Export to CSV” button. Anonymous contacts will not be listed in this side panel even if they’re counted as part of the query result.
Active contacts / Active accounts
For contacts
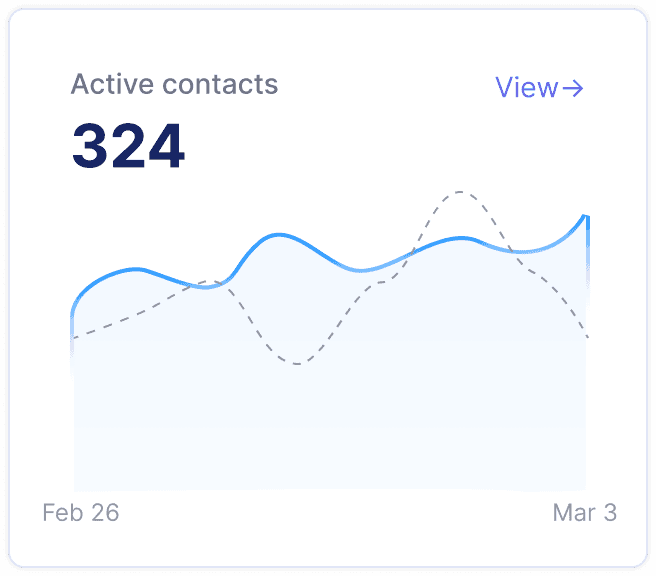
The number of active contacts across the last 7 days.
For accounts
The number of accounts who had at least one active contact within the last 7 days.
Contacts and accounts are designated as active if they have triggered an active event within a defined date range. Examples of active events are:
Page views
Tracked events
Email clicks
Contacts with passive events, e.g. a contact who was sent an email or opened an email, are not counted in this metric. You can read more about what designates a contact as ‘active’ in our contact documentation.
The previous week’s values are represented by a gray dotted line on the chart. This feature allows you to see if your metrics are improving over time. You can also view the matching contacts and accounts by clicking the “view” button, or export them to CSV by clicking the “Export to CSV” button.
New signups / New accounts
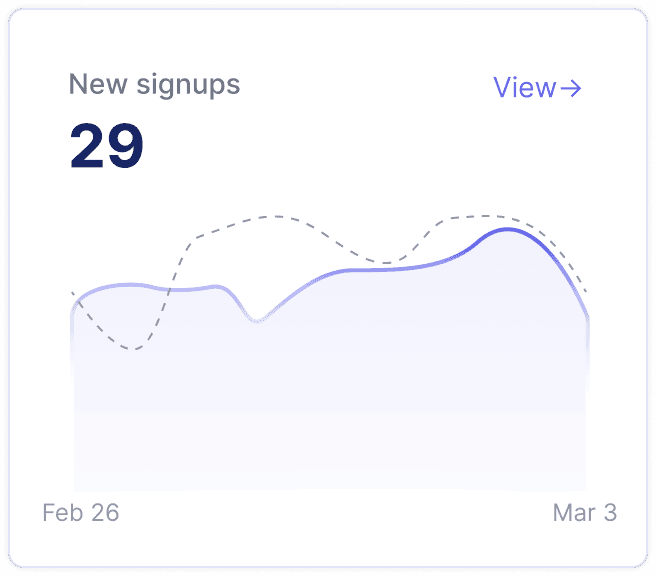
For contacts
The number of new signups for your product across the last 7 days.
The below criteria is used to define a new signup. If no contacts match the criteria, the number will be shown as 0.
A contact must be associated with an event that contains the words “sign up” or "signed up". We recommend sending events that follow the Segment B2B SaaS spec.
The Sign Up event must be a track event type, not a page view or identify call.
The Sign Up event must be from a data source with a selected source type of “product”. This helps Flywheel filter out false-positive events, such as clicks on website buttons that say “Sign Up”. Learn more here about source types.
For accounts
The number of net-new accounts created across the last 7 days.
The below criteria is used to define a new account. If no accounts match the criteria, the number will be shown as 0.
A contact, with a company email, must be associated with an event that contains the words “account created”. We recommend sending events that follow the Segment B2B SaaS spec.
The previous week’s values are represented by a gray dotted line on the chart. You can view the matching contacts and accounts by clicking the “view” button, or export them to CSV by clicking the “Export to CSV” button.
Asset engagement
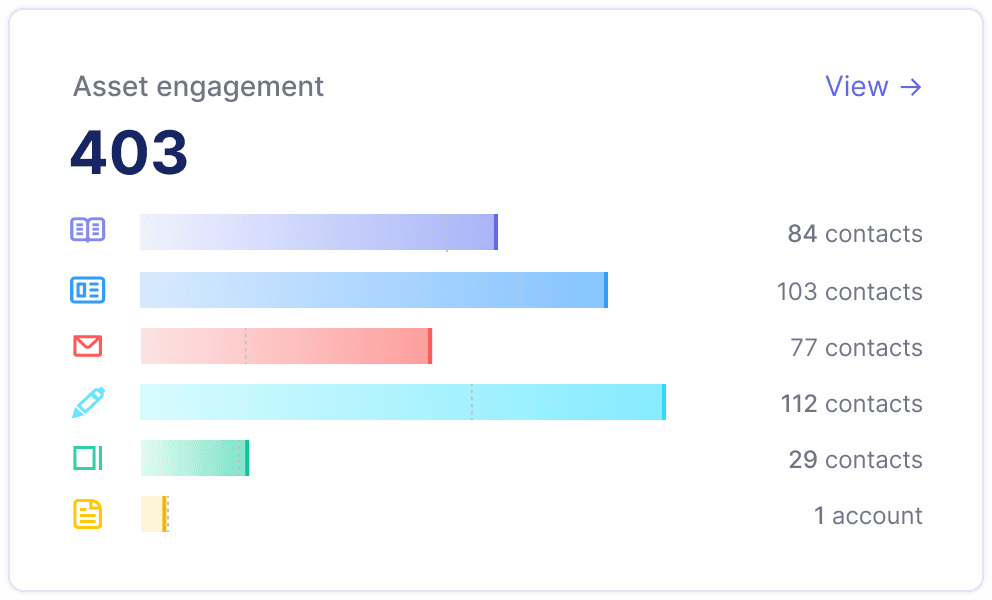
Asset engagement calculates contact, or account, engagement with marketing channels in the last 7 days. You can hover over each asset category to benchmark your current week's engagement against the previous week's figures. Similar to all the other metrics, you can view your asset engagements at a contact or account level, with a simple switch of view.
The Asset engagement section tracks the following asset categories:
Web pages
Blog posts
Documentation
Emails
Articles
Landing pages
When the ‘segments’ filter is applied to your Home page, only contacts and accounts who match the segment will be shown. This allows you to see what marketing channels are most effective for different user personas. For more detailed insights into your asset performance, click the "view" button and explore our Assets Overview page.
Milestones
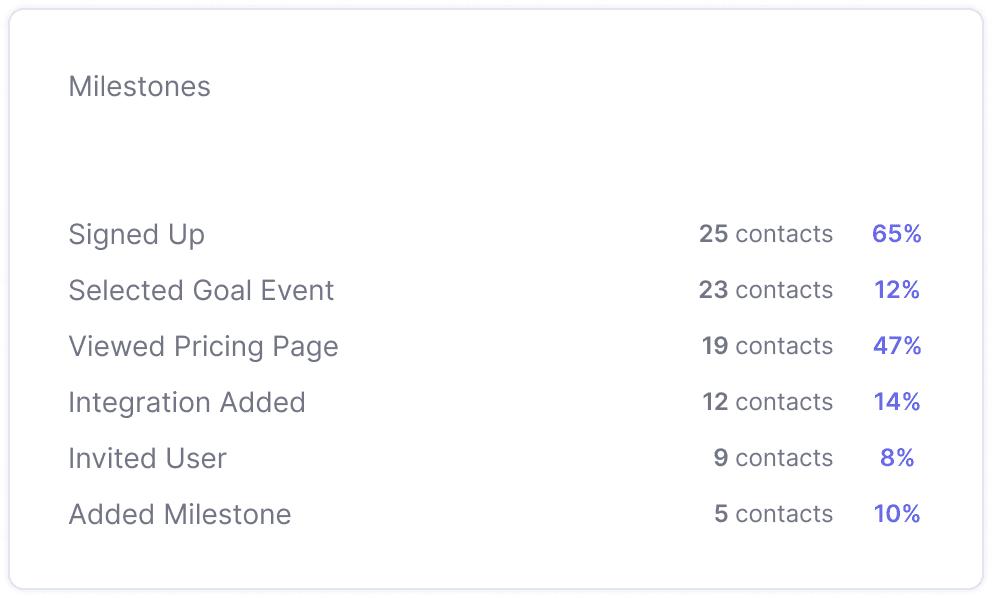
At Flywheel, we define milestones as significant website, in-product, or marketing events that indicate a prospect is likely to purchase or adopt your software. Once you’ve defined your Milestones from your settings, you can view their performance at a contact or account level from your Home page.
Clicking on a milestone row will show you the number of contacts, or accounts, who have triggered the milestone. You can export these lists by clicking “Export to CSV”.
For contacts
The number of contacts who have triggered the milestone event at least once. The percentage rate to the right is calculated as: (contacts who triggered the milestone) / (total number of contacts). This number is an all-time metric.
If a Segment filter is applied, the percentage rate will be calculated as: (contacts who belong to the Segment AND who triggered the milestone) / (total number of contacts who belong to the Segment).
For accounts
The number of accounts who have 1.) At least one contact who, 2.) Triggered the milestone event at least once. The percentage rate to the right is calculated as: (accounts with a contact who triggered the milestone) / (total number of accounts). This number is an all-time metric.
If a Segment filter is applied, the percentage rate will be calculated as: (accounts with a contact who belongs to the Segment AND a contact who triggered the milestone) / (total number of accounts with a contact who belong to the Segment).