Deep dive: Flywheel vs Posthog
Flywheel and Posthog are both platforms that offer a number of interconnected products to their users.
Posthog is heavily focused on developers and engineers, helping companies build features more quickly and show them to specific user subsets via feature flags. Companies looking to have an engineering-led culture will appreciate Posthog's flexibility and feature depth.
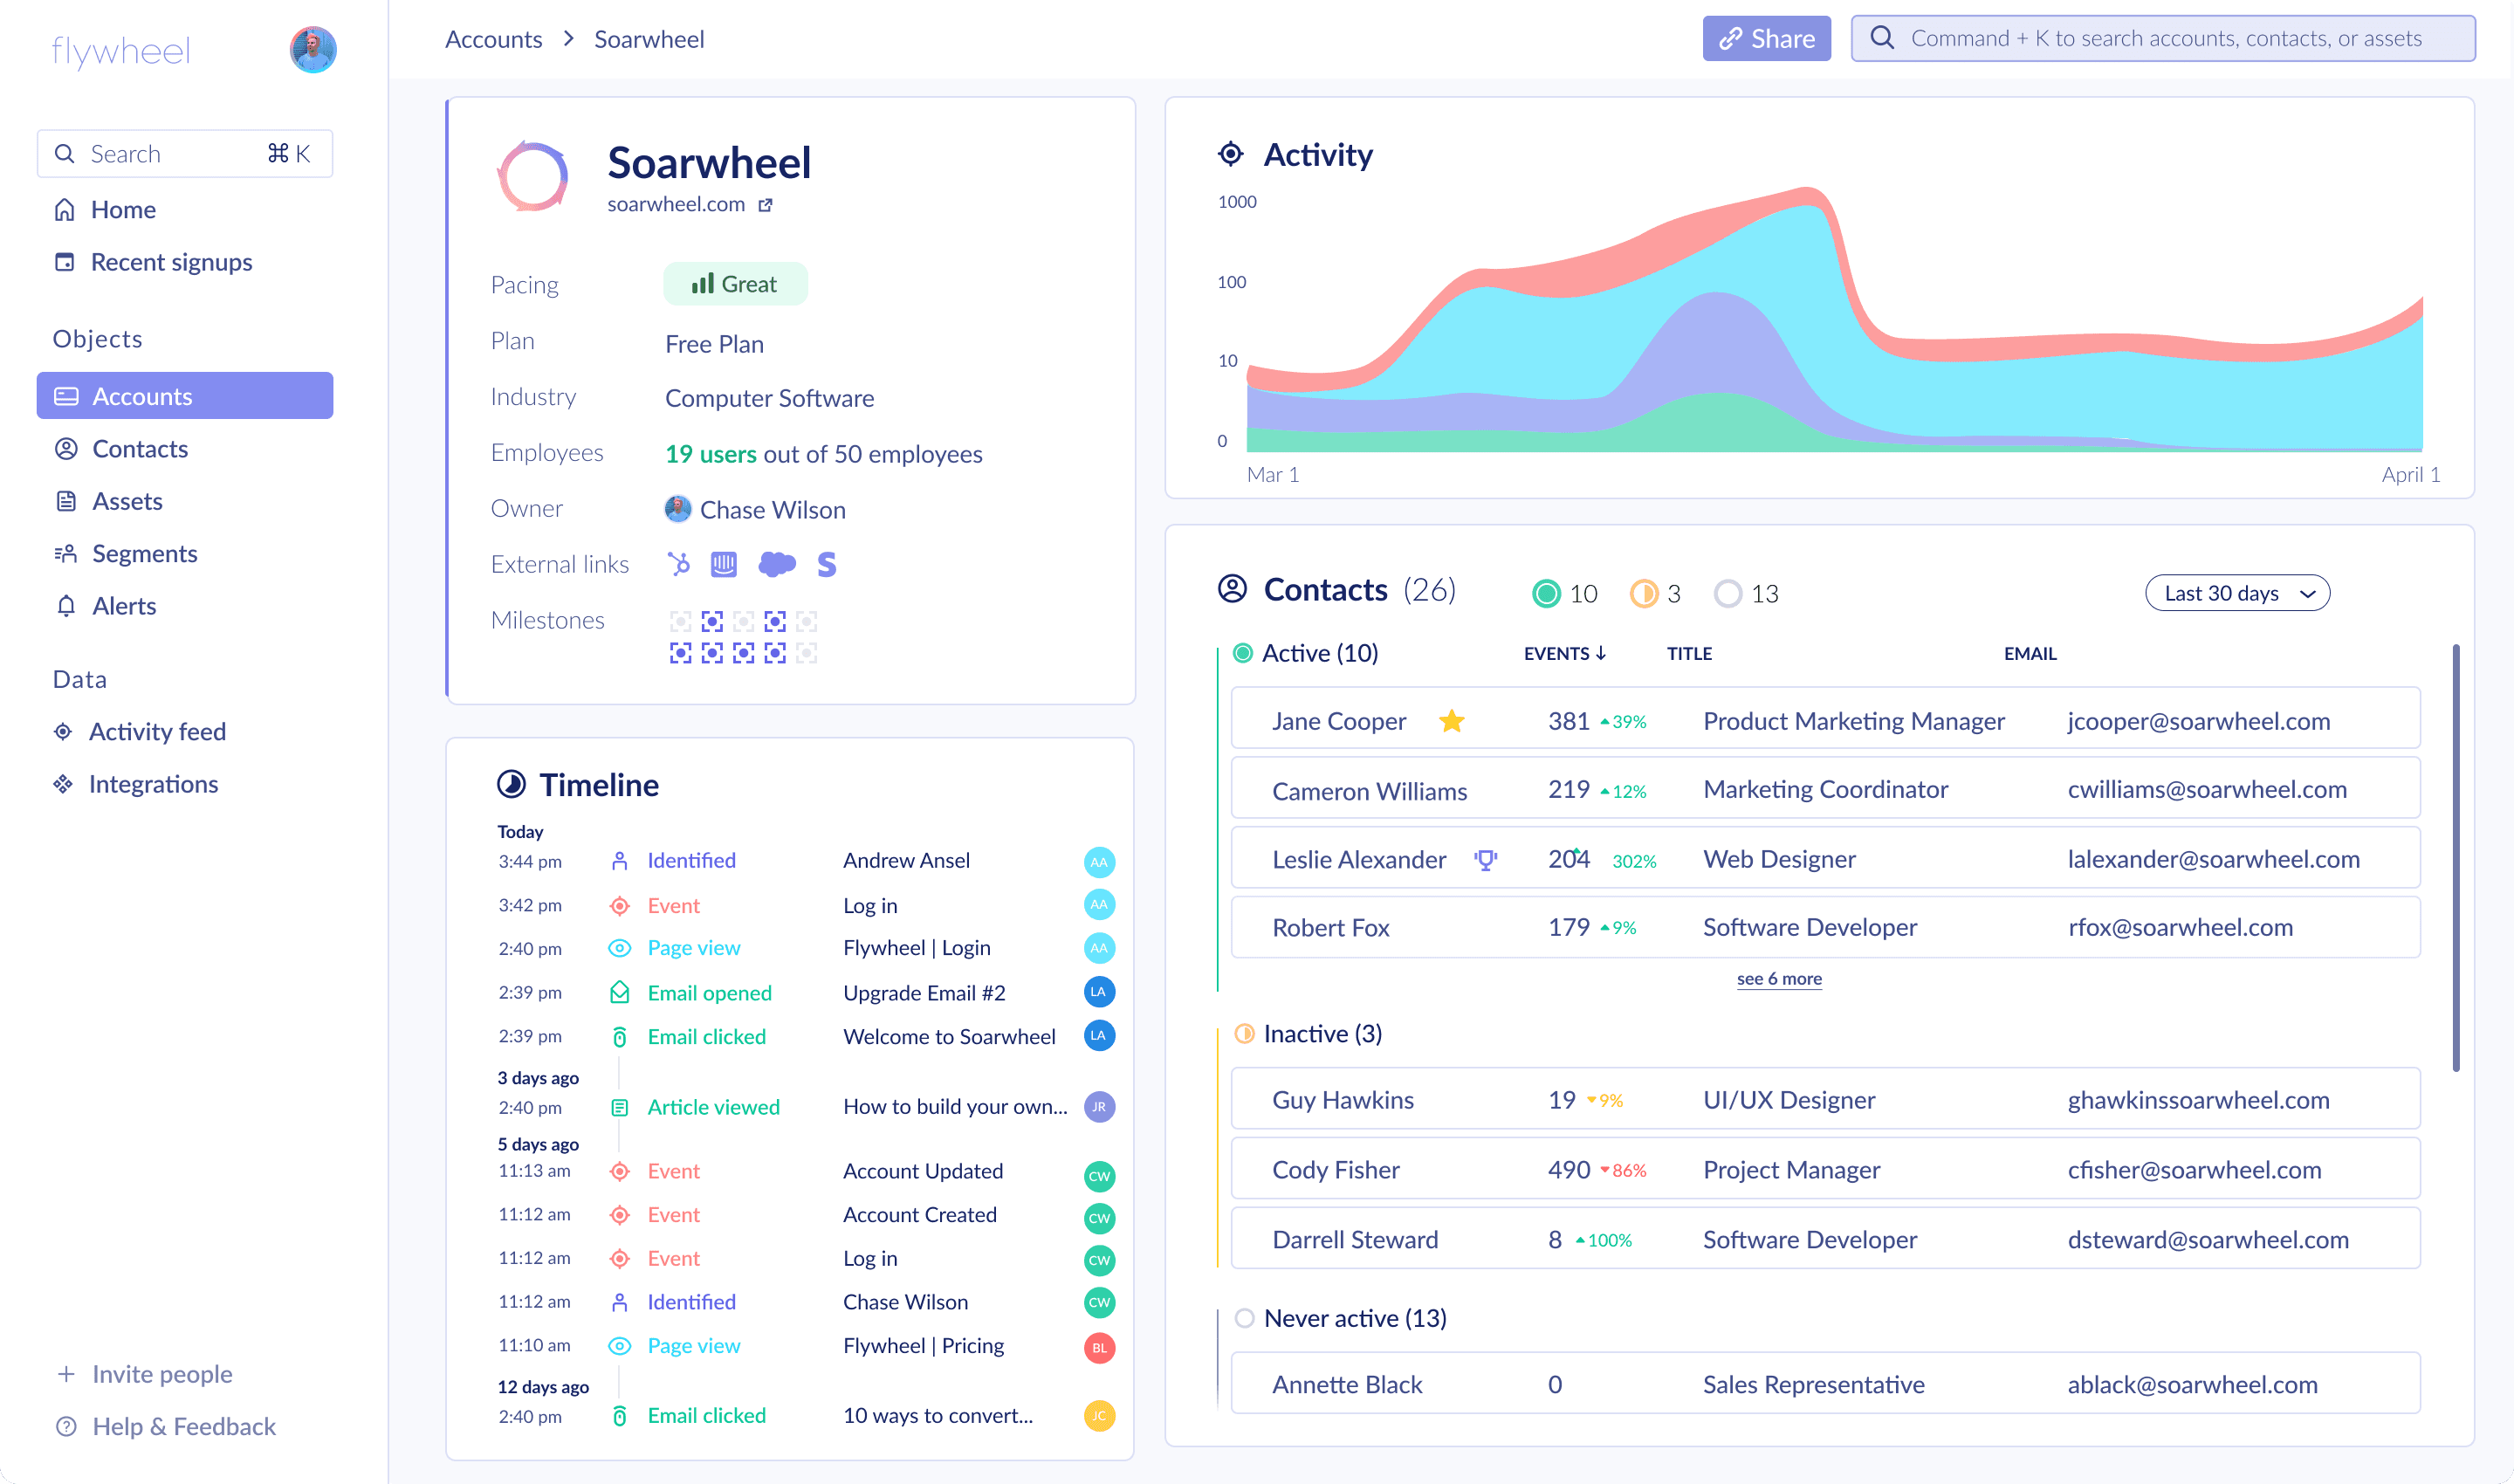
In comparison, Flywheel is an all-in-one growth platform that unites product and marketing analytics with website personalization, user engagement, and session replays. This helps companies grow more quickly by converting users with personalized experiences.
How is Flywheel different from Posthog?
It's an all-in-one growth platform
Both Flywheel and Posthog consider themselves all-in-one platforms and have overlapping products available. However, Flywheel focuses on affecting the user experience with features such as website personalization, user engagement, and alerting. Posthog is built for engineers and includes features such as feature flags, a data warehouse, and more ingestion integrations.
Built for go-to-market teams
Flywheel combines multiple product categories in unique ways for each team, all focused on a no-code approach to modern GTM. For example, Product teams leverage product analytics and session replay to understand user behavior, while Customer Success teams use account scoring and auto-detection of Champions and Power Users. Marketing teams use website personalization backed by marketing analytics, and so on.
Designed for immediate value
Whether it's auto-tracking events via Flywheel.js, instant asset creation, or segmenting users intelligently, Flywheel does almost all of the work for you. All you need to do is choose marketing goals, decide which features to monitor, and create user experiences you think will move the needle.
Flywheel vs Posthog: feature comparison
Features
Flywheel
Posthog
Flywheel strengths
Both Posthog and Flywheel offer Account-based analytics within their platforms, which is essential for B2B platforms to track. However, unlike Flywheel, Posthog only offers Account-based analytics as an add-on, which needs to be paid for separately. Additionally, Account analytics are only available via custom group calls implemented by an engineer.
Assets allow you to optimize your channels. Flywheel allows you to optimize your channels by conducting in-depth comparisons. This helps you identify which categories – such as email, web pages, and documentation – contribute most effectively to user acquisition. By leveraging this data-driven approach, you gain a competitive edge in fine-tuning your channel selection and ensuring that your efforts yield the best results. This strategic advantage is powerful in helping you grow your business forward and achieving your desired objectives.
In Flywheel, Milestones represent important events within your website, product, or marketing efforts that signal progress towards increased software adoption or sales. These milestones can be chosen from the various events and page views tracked by Flywheel. Our users find the Milestones feature valuable as it enables them to pinpoint and celebrate crucial moments of user engagement or conversion, providing essential insights into the effectiveness of their marketing and product strategies.
Engagements allow users to seamlessly post banner messages directly onto their platforms, display modals, or ask users survey questions. There are infinite ways to engage with users via Flywheel.
Posthog strengths
Posthog’s heatmaps provide a visual representation of user interaction with various elements on your website or app, offering valuable insights into user behavior and preferences. This is another way, in addition to session replays, of understanding which parts of your platform attract the most attention and engagement.
In contrast to Flywheel's pre-built dashboard tailored for PLG growth tracking, PostHog offers customizable dashboards that allow you to consolidate various charts and insights into a unified view. While these dashboards are accessible to project members, you also have the option to share them with non-PostHog users through links or embed them on public web pages.
Posthog offers A/B testing capabilities that empower you to assess the effects of product modifications and gain insights into their influence on user behavior.
Posthog offers feature flags as part of their developer-first approach to product development.
Flywheel vs Posthog: Pricing
Posthog offers a freemium pricing model. Its free tier includes 1 million events and 15,000 session replays per month. For a standard medium-sized B2B product with approximately 10,000 monthly active users, generating an average of 100 events and 5 sessions per user each month, the usage would typically amount to 1 million events and 50,000 session replays monthly.
Flywheel's also offers a freemium pricing modal. Its pricing is based on the number of monthly active contacts (MACs) and its free tier allows unlimited events and 3,000 session replays per month. The free entry-level plan supports up to 1,000 users, granting access to essential PLG data. For products exceeding 1,000 MAUs and requiring more advanced capabilities, such as 10 milestones, 10 segments, and 10 goals, the cost is $200/month. If you need unlimited analysis of milestones, segments, and goals, along with additional growth-focused features, the price starts at $500/month.


